

A lot of affiliate buyers still shop offers the same lazy way: they open the list, sort by payout, and get hypnotized by the biggest number on the page. A $120 payout looks sexy. A $45 payout looks average. A $22 payout looks boring. So they assume the math is obvious: higher payout means more money, and more money means better offer. That logic kills margin every day.
The problem is simple: payout is not profit. It is only one variable in the revenue equation, and usually not the one that decides whether the setup is actually worth scaling. A high payout can hide terrible approval, ugly traffic quality requirements, weak call-center close rates, brutal hold periods, and an offer flow that looks good in screenshots but collapses under real traffic. Meanwhile, a lower-payout offer with cleaner approval and stronger backend can quietly outperform the “premium” offer by 20–50% on actual net profit. If you read this through, you’ll get the real picture: why payout by itself is misleading, what approval rate is really telling you, how those two metrics work together, where buyers usually leak money, and how to compare offers like a buyer who cares about margin instead of brochure numbers.
Contents
- Why payout is misleading
- What approval rate actually shows
- How payout and approval work together
- Where most money is lost
- How to evaluate offers correctly
- FAQ
Why payout is misleading
The first thing to lock in is this: the number you see in the offer card is usually the most flattering version of the story. It tells you what the network is willing to pay per approved event, not what your traffic will actually earn per click, per lead, or per dollar spent. Those are very different questions.
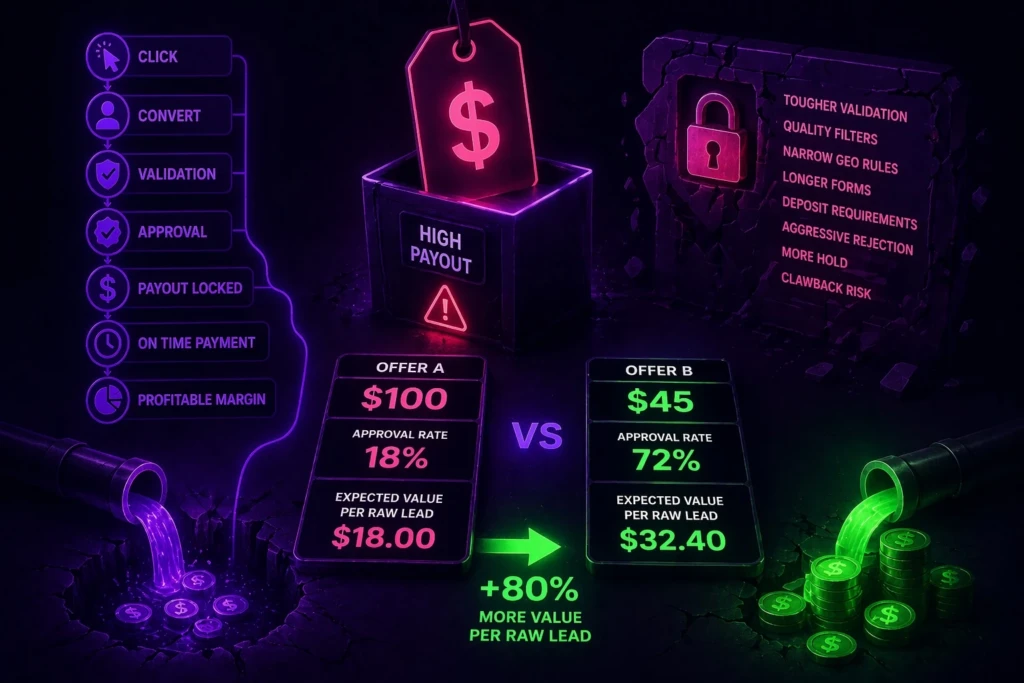
A payout is only valuable after a long chain holds up:
- the user clicks
- the user converts
- the lead passes validation
- the lead gets approved
- the payout remains unchanged
- the network actually pays on time
- your cost structure still leaves margin
That means the payout number is not the finish line. It is just the sticker price on the box.
High payout illusion
Big payout numbers are attractive because they compress complexity. A buyer sees $90 CPA, $120 lead payout, or $250 sale payout and immediately starts imagining upside. If the offer converts at all, the brain starts doing quick fantasy math. “Ten conversions is $1,200. Fifty conversions is $6,000. This thing has room.”
That is exactly why the metric is so dangerous. It creates the feeling of upside before the harder questions even get asked. The offer with the biggest payout often gets treated like the premium opportunity, even when the real economics are weaker than a so-called smaller offer.
Take a simple example. Offer A pays $100 per approved lead. Offer B pays $45. On the surface, A looks more than twice as good. But if Offer A approves only 18% of leads and Offer B approves 72%, the value picture changes immediately.
- Offer A expected approved revenue per raw lead: $100 × 0.18 = $18
- Offer B expected approved revenue per raw lead: $45 × 0.72 = $32.40
The “smaller” offer is actually worth 80% more per raw lead before you even get into hold periods, call quality, or backend performance. That is why payout vs approval rate is one of the most important comparisons in affiliate marketing profit calculation.
Ignoring conversion reality
The second problem is that high payouts usually come attached to stricter conversion reality. The higher the payout, the more likely the advertiser is protecting that number with tighter rules:
- tougher lead validation
- stronger quality filters
- narrower geo rules
- longer forms
- deposit or funding requirements
- more aggressive call-center rejection
- more hold
- more clawback exposure
So even if the payout itself is real, the path to earning it may be much uglier than the offer card suggests.
That is where buyers get smoked. They compare offers as if all leads are created equal. They are not. One $80 payout lead might require a full funded event with post-call verification and two-step qualification. Another $35 payout lead may clear cleanly with a much stronger approval curve and faster cash cycle. If you do not understand that difference, you are not choosing offers. You are choosing headlines.
What approval rate actually shows
Approval rate is not glamorous, but it is one of the most honest metrics in the whole business. It tells you how much of your visible volume survives contact with commercial reality.

Approved vs total leads
At the simplest level, approval rate is:
Approved leads / Total leads × 100%
If you sent 200 leads and 110 were approved, your approval rate is 55%. That is the visible number. But what it really tells you is deeper: it tells you how much of your traffic is commercially acceptable to the advertiser under the actual rules of the offer.
That matters because raw lead count means nothing by itself. A campaign with 300 leads at 30% approval is not automatically better than a campaign with 180 leads at 75% approval. In many cases, the second setup is the real winner because the volume is cleaner, the economics are easier to trust, and the scaling path is safer.
Example:
Offer A
- 300 raw leads
- payout: $40
- approval: 30%
- approved revenue: 300 × 0.30 × 40 = $3,600
Offer B
- 180 raw leads
- payout: $35
- approval: 75%
- approved revenue: 180 × 0.75 × 35 = $4,725
Lower raw lead volume. Lower payout. Higher approved revenue. That is how approval quietly beats payout.
Quality of traffic impact
Approval rate also functions like a truth serum for your traffic. It tells you whether your audience is actually aligned with the offer or just good at making dashboards look busy.
Weak traffic usually shows up in approval first:
- users click but do not qualify
- users fill but do not verify
- users register but do not fund
- users answer but do not convert downstream
- users look real in the tracker but fail in the business logic
That is why a low approval rate is not always “the offer is bad” and a high approval rate is not always “the buyer is brilliant.” Sometimes it is offer quality. Sometimes it is source quality. Sometimes it is the angle. Sometimes it is the prelander. Often it is the combination.
In practical terms, approval rate is one of the fastest ways to see whether the traffic is commercial or just active. A setup with $0.50 CPC, decent CVR, and 22% approval is often much weaker than a setup with $0.80 CPC, slightly lower front-end conversion, and 68% approval. Cheap activity is not the same as profitable activity.
How payout and approval work together
This is the section that actually matters. Buyers love debating which metric is “more important.” That is the wrong question. The real question is how they combine.
Real profit formula
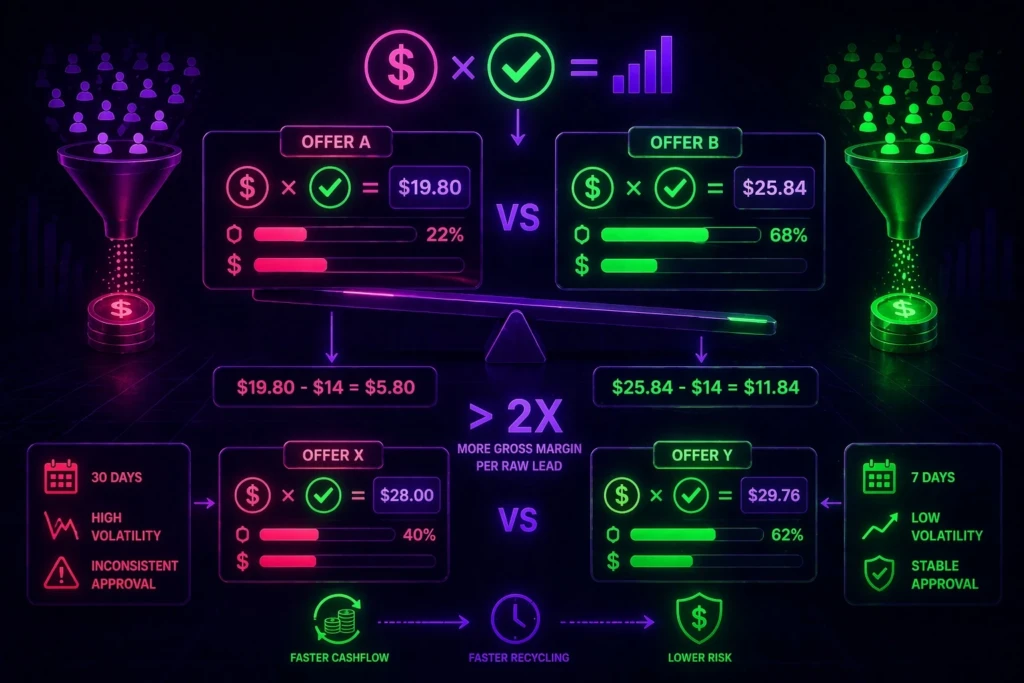
At a simplified offer-comparison level, expected approved value per raw lead is:
Payout × Approval Rate
That is not full profit yet, but it is already far more useful than payout alone.
Now let’s make it practical.
Offer A
- payout: $90
- approval: 22%
- expected value per raw lead: $19.80
Offer B
- payout: $38
- approval: 68%
- expected value per raw lead: $25.84
Even before subtracting traffic cost, Offer B is already stronger in expected approved value. If the traffic cost per raw lead is $14 on both offers, then:
- Offer A gross margin per raw lead: $19.80 – $14 = $5.80
- Offer B gross margin per raw lead: $25.84 – $14 = $11.84
Offer B is producing more than 2x the gross margin per raw lead despite having less than half the payout.
That is why cpa payout vs approval comparisons need to be done on expected value, not on headline payout.
Comparing offers with different metrics
This gets even more important when buyers are deciding between two “good” offers.
Imagine this choice:
Offer X
- payout: $70
- approval: 40%
- expected approved value: $28
Offer Y
- payout: $48
- approval: 62%
- expected approved value: $29.76
At this stage, the difference looks small. But then you add hold and payout speed.
- Offer X hold: 30 days
- Offer Y hold: 7 days
- Offer X rejection volatility: high
- Offer Y approval consistency: stable
Now the real business advantage tilts even harder toward Offer Y. Same traffic, faster capital recycling, less uncertainty, better cashflow. The smarter offer is not always the one with the sexier number. It is the one that keeps the machine alive.
Where most money is lost
This is where most buyers quietly bleed. They do not usually lose because they never had a chance. They lose because they misread what matters.
Choosing high payout with low approval
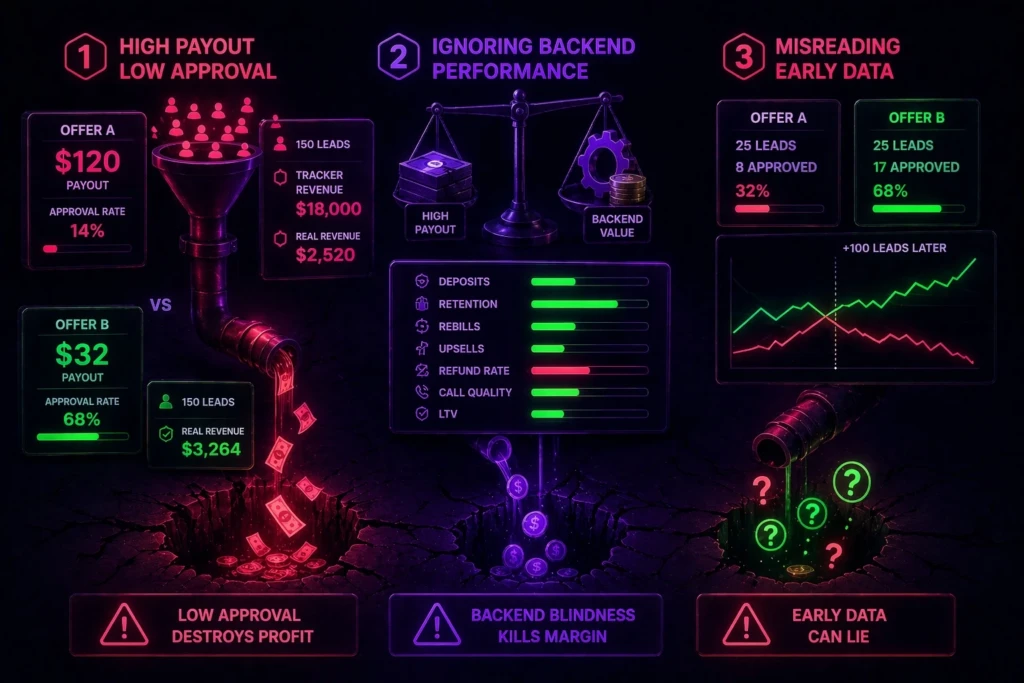
This is the classic mistake. A buyer sees $120 payout, ignores that approval is shaky, and pushes traffic into an offer that was never built to clear cleanly. The early numbers look exciting because raw leads come in, tracker revenue looks fat, and the setup feels “premium.” Then approvals settle, the net revenue collapses, and the campaign that looked like a monster turns out to be average or negative.
Example:
- 150 leads
- payout: $120
- visible tracker revenue fantasy: $18,000
- approval: 14%
- real approved revenue: $2,520
Now compare that to a “boring” offer:
- 150 leads
- payout: $32
- approval: 68%
- real approved revenue: $3,264
The lower payout offer wins. Not by theory — by actual money.
Ignoring backend performance
The second leak is backend blindness. A lot of buyers stop at the first approved payout and never ask what happens after that. But in many verticals, the front number is not the whole value story. Deposits, retention, rebills, upsells, refund rate, call-center quality, and LTV all matter.
A high payout offer can still be commercially weak if:
- users refund harder
- users deposit less
- retention is ugly
- quality is inconsistent
- advertiser rules tighten after initial scale
Meanwhile, a lower payout offer can outperform because the downstream economics are stronger. This is especially important when choosing between two offers with similar front-end expected value. The “better” offer is often the one with the healthier backend, not the louder card.
Misreading early data
The third leak is sample-size stupidity. Buyers love making conclusions off 20 leads, 40 leads, maybe $300–$500 in spend. That is not enough in many cases, especially if the approval window is soft.
Early data is noisy because:
- approval hasn’t settled
- time lag is still distorting reality
- lead quality is unstable
- one good batch can flatter the setup
- one bad batch can unfairly kill it
Say Offer A starts with:
- 25 leads
- 8 approved
- visible approval: 32%
Offer B starts with:
- 25 leads
- 17 approved
- visible approval: 68%
That looks decisive. Then another 100 leads come in and the story flips because one offer stabilizes and the other does not. If you choose offers based on tiny samples, you are not comparing offers. You are comparing noise bursts.
How to evaluate offers correctly
So what should replace lazy payout chasing? Not one magic metric. A cleaner process.

Calculating expected value
Start with expected approved value per raw lead:
Expected Value = Payout × Approval Rate
Then estimate gross margin:
Expected Gross Margin per Lead = (Payout × Approval Rate) – Cost per Lead
Now compare offers on the same traffic assumption.
Example:
Offer A
- payout: $60
- approval: 35%
- CPL: $17
- expected margin: ($60 × 0.35) – $17 = $4
Offer B
- payout: $36
- approval: 70%
- CPL: $17
- expected margin: ($36 × 0.70) – $17 = $8.20
Offer B gives you more than double the expected margin with a much smaller payout.
Testing before scaling
Then test properly before getting emotionally attached. If an offer has only seen $300–$500 in spend or the approval cycle is still incomplete, it has not earned scale yet. You are not just testing the lander and angle. You are testing the full commercial chain.
A safer workflow is:
- run small but meaningful volume
- wait for early approvals to settle
- compare expected vs actual value
- check rejection pattern
- confirm payout behavior
- only then consider scale
This slows down the dopamine hit, but it protects capital.
Working with managers and data
Good AMs are useful if you ask the right questions. Bad AM conversations are usually just, “What converts best?” Good AM conversations are:
- what is the real recent approval band?
- what is the hold?
- how volatile is approval?
- what traffic sources are getting clipped?
- what does clean quality look like?
- what is the real net value after rejection?
- what is the backend like?
You are not buying access to an offer card. You are buying exposure to a payout system. Ask for the real numbers, not the brochure numbers.
Tracking full funnel performance
Finally, stop evaluating offers on lead count alone. Track:
- clicks
- raw CVR
- approved CVR
- payout
- approval rate
- hold
- payout speed
- refund / clawback pattern if relevant
- backend value where possible
The stronger your funnel view, the less likely you are to fall for the high payout illusion.
FAQ
What is a good approval rate in affiliate marketing?
There is no universal number, but in general a “good” approval rate is one that still leaves healthy margin after traffic cost and hold. In many leadgen flows, anything under 30–35% needs strong payout to survive, while 50–70% is often much easier to scale.
Is higher payout always better?
No. Higher payout only matters if approval, quality rules, and cashflow still make the setup profitable. A lower payout offer with cleaner approval can easily outperform a premium-looking offer.
How do I calculate real profit per lead?
Start with payout × approval rate, then subtract your real cost per lead. After that, account for hold, rejection volatility, and backend value if relevant.
Can low payout offers be more profitable?
Absolutely. In many cases they are. Lower payout offers often win because approval is stronger, the flow is cleaner, and the money turns faster.
How do I choose between two offers?
Compare expected approved value, approval stability, payout timing, traffic fit, and backend strength. Do not choose based on payout alone.