

A media buyer can launch campaigns every day, keep traffic flowing, hit “decent” CTR, see conversions in the tracker, and still quietly lose money. That is the ugly part of paid traffic: budget burn does not always look like disaster. Sometimes it looks like movement. Clicks are coming in, leads are firing, spend is pacing, the account looks alive — but the economics are already bleeding underneath.
Most affiliate marketing budget loss happens before the buyer admits there is a problem. The campaign does not always crash. It drifts. CPA gets softer. Approval gets worse. Traffic quality drops. Testing gets messy. Tracking misses costs. The buyer keeps optimizing the visible layer while the real business layer gets weaker. This article breaks down why media buyers lose money, where the leaks usually sit, how metrics hide the burn, and how to stop wasting budget before the campaign teaches you the lesson the expensive way.
Contents
- Why budget losses are hard to notice
- Common mistakes that drain budgets
- Where money leaks in the funnel
- How metrics hide real losses
- How to detect and stop budget burn
- FAQ
Why budget losses are hard to notice
Budget loss is hard to notice because campaigns rarely tell the full truth in one place. Facebook Ads gives one version of reality. The tracker gives another. The affiliate network gives a third. Finance gives the final, painful version after approvals, payouts, fees, infra, and rejected leads settle.
That delay is where the damage happens. The buyer is making decisions in real time, but the real profit picture often arrives late. So the campaign can look manageable on Monday, suspicious on Wednesday, and dead by payout reconciliation.

Illusion of good metrics
Good metrics are not always good economics. That is one of the most common media buying mistakes.
A campaign can show:
- 1.8% CTR
- $0.55 CPC
- $18 CPA
- +25% tracker ROI
- stable daily spend
- no obvious account issues
And still be weak if approval is low, backend value is poor, or hidden costs are ignored. The buyer sees a campaign that “has something.” The business sees traffic that does not turn into enough money.
The problem is that surface metrics create emotional safety. A campaign with terrible CTR and zero conversions gets killed fast. A campaign with okay numbers survives. That is where budget quietly burns.
Example:
- spend: $2,000
- tracker revenue: $2,600
- tracker ROI: 30%
Looks fine. But then:
- approval haircut: 25%
- tool and account allocation: $220
- creative cost allocation: $140
- payment friction: $60
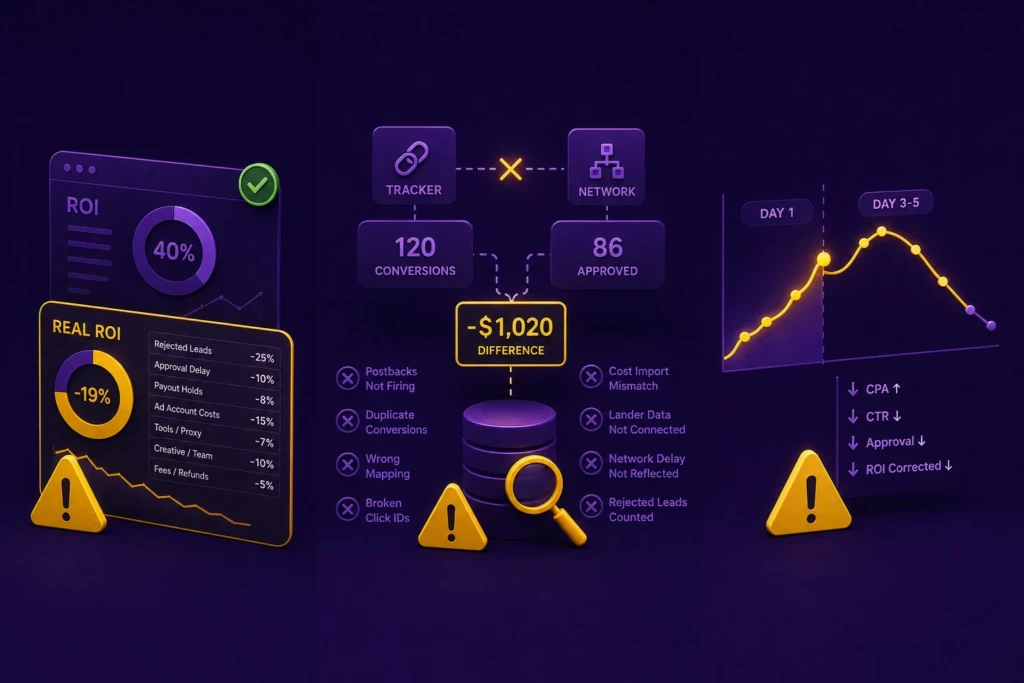
Real revenue drops to $1,950. Real cost becomes $2,420. The campaign is not at +30% ROI. It is at roughly -19.4% real ROI.
The dashboard did not look terrible. That is exactly why it was dangerous.
Fragmented data across systems
Another reason budget loss hides well is fragmented data. Most affiliate teams do not have one clean source of truth.
The ad account shows:
- spend
- CPM
- CPC
- CTR
- platform CPA
The tracker shows:
- clicks
- conversions
- postback revenue
- ROI
- lander performance
The affiliate network shows:
- approved leads
- rejected leads
- payout changes
- caps
- hold status
Finance shows:
- cash received
- payout delay
- fees
- refunds
- operating cost
If these systems are not reconciled, the buyer ends up optimizing a partial picture. That is where facebook ads budget problems become business problems. The buyer may be improving CPC while approval collapses. Or scaling a campaign that looks profitable in the tracker but is already negative after network validation.
A 5–10% mismatch between systems can be normal. A 20–30% mismatch is decision risk. If the buyer keeps scaling inside that gap, they are not scaling performance. They are scaling uncertainty.
Common mistakes that drain budgets
Most budget drain comes from repeatable behavior patterns. The buyer is not necessarily careless. They are usually moving too fast, trusting weak signals, or solving the wrong problem.

Scaling too early
Early scaling is one of the cleanest ways to burn budget. A campaign gets a few good conversions, the buyer sees green ROI, and suddenly the budget goes from $150/day to $500/day, then $1,500/day before the setup has enough proof.
That is not confidence. That is impatience with a budget attached.
Early results are often inflated by:
- small sample size
- stronger first responders
- cheap initial auction pockets
- incomplete approval data
- delayed rejections
- low creative frequency
- early algorithm optimism
At $300 spend, a campaign can look like a winner. At $3,000 spend, the same campaign may reveal that the first signal was just a clean pocket, not a scalable setup.
A safer scale signal needs more than a green tracker. It needs:
- enough spend depth
- stable CPA
- acceptable CTR drift
- approval signal
- no tracking mismatch
- no obvious creative fatigue
- account stability
- payout quality
Without those, scaling is just making the loss bigger before the data is mature enough to stop you.
Poor creative testing
Poor creative testing burns budgets because it makes bad conclusions look valid. Buyers often test too many variables at once: new angle, new format, new lander, new GEO, new audience, new offer, new account path. When the test fails, nobody knows what failed.
Then the team says:
“The offer is dead.”
“The audience is bad.”
“Facebook is unstable.”
“The creative didn’t hit.”
Maybe. Or maybe the test was structured so badly that the result is unreadable.
A clean creative test should answer one main question at a time. If you are testing a new hook, keep the format stable. If you are testing format, keep the angle stable. If you are testing a new audience, do not rotate every creative at the same time.
Bad creative testing creates three budget leaks:
First, weak creatives run too long because the team does not know what is weak. Second, strong ideas get killed too early because they were tested in a dirty environment. Third, buyers keep producing more assets without understanding what actually moved the metric.
That is expensive. Creative volume does not matter if the feedback loop is broken.
Ignoring audience quality
Cheap traffic can make a buyer feel smart while killing the campaign slowly. Low CPM, low CPC, and easy click volume are seductive because they make the dashboard look active. But cheap users are not automatically profitable users.
Audience quality shows up deeper in the funnel:
- landing page engagement
- continuation rate
- lead quality
- approval rate
- deposit rate
- refund rate
- retention
- LTV
A campaign can get clicks at $0.30 and still be worse than a campaign getting clicks at $0.75 if the second audience has real intent. This is especially common in affiliate marketing mistakes 2026: buyers optimize for cheap reach while the real loss happens after the click.
The platform can buy cheap impressions. It cannot force weak users to become valuable customers. That part is on the offer, funnel, and traffic match.
Where money leaks in the funnel
Budget does not vanish only in the ad account. It leaks across the funnel. The earlier the buyer finds the leak, the cheaper the lesson.

Click to lead drop-off
The first leak is the gap between click and lead. If users click but do not continue, either the traffic is wrong, the promise is mismatched, the landing page is weak, or the page is technically broken.
Common click-to-lead issues:
- slow lander load
- weak headline match
- confusing CTA
- too much friction
- mobile layout problems
- broken tracking
- poor prelander logic
- audience curiosity without intent
Example:
Campaign A:
- 5,000 clicks
- 400 leads
- click-to-lead rate: 8%
Campaign B:
- 3,200 clicks
- 480 leads
- click-to-lead rate: 15%
If Campaign A has cheaper clicks, the buyer may keep defending it. But Campaign B may be the better business because the funnel continuation is almost 2x stronger.
This is why CPC alone is not enough. The question is not “how cheap was the click?” The question is “what did the click become?”
Lead to sale problems
The second leak is where many buyers get slapped by reality. Leads are not revenue. Approved, paid, valuable leads are revenue.
Lead-to-sale problems include:
- low approval
- weak call-center contact rate
- poor deposit rate
- fake or low-intent registrations
- mismatch between ad promise and offer terms
- advertiser quality filters
- payout cuts
- rejected batches
- slow validation
A buyer may generate 200 leads at $20 CPA and think the campaign is stable. But if only 45% approve on a $35 payout, then expected approved revenue per raw lead is:
$35 × 0.45 = $15.75
If the raw lead costs $20, the buyer is losing $4.25 per lead before infra and labor. The campaign is not close. It is structurally negative.
That is one of the most common reasons why campaigns lose money: the buyer optimizes lead count instead of approved value.
Backend performance issues
The third leak sits after the first payout. Many buyers never look there, especially if they are running CPA. But backend performance still matters because advertisers adjust payouts, approvals, caps, and access based on quality.
Weak backend performance can mean:
- low LTV
- high refund rate
- weak retention
- poor deposit quality
- bad call-center outcomes
- high fraud flags
- low repeat value
- low advertiser margin
If the advertiser sees bad backend quality, the affiliate eventually feels it through lower approval, tighter caps, payout cuts, longer holds, or offer removal. So even when the buyer is paid on a front-end event, backend quality still affects future economics.
A campaign that prints quick leads but sends junk users is not a real asset. It is a short-term extraction play, and those usually die faster in 2026.
How metrics hide real losses
Metrics are supposed to help buyers see reality. But if they are incomplete, delayed, or interpreted badly, they can hide losses better than no metrics at all.
ROI vs real profit
Tracker ROI is one of the most abused numbers in affiliate marketing. It is useful, but only if the data underneath is complete and final. Usually, it is not.
Tracker ROI often ignores:
- rejected leads
- delayed approval
- payout holds
- duplicate conversions
- missing postbacks
- account costs
- proxy and anti-detect spend
- creative production
- team cost
- payment fees
- refund or clawback risk
So when a buyer says “this campaign has 40% ROI,” the next question should be: on what data?
If it is raw postback revenue minus ad spend, that is not real profit. That is a first draft.
Real profit is closer to:
Approved collectible revenue – full cost
And real ROI is:
(Approved collectible revenue – full cost) / full cost × 100%
That formula is less sexy. It is also much harder to fool.
Incomplete tracking data
Incomplete tracking data can make losers look like winners and winners look like losers. Both are expensive.
Common tracking problems:
- postbacks not firing
- conversions duplicated
- cost import mismatch
- wrong campaign mapping
- broken click IDs
- lander data not connected
- network delay not reflected
- rejected leads still counted as revenue
Imagine the tracker logs 120 conversions, but the network validates only 86. If payout is $30, the tracker shows $3,600revenue while real approved value is $2,580. That $1,020 difference can completely change the decision.
The buyer may scale a campaign that should have been paused, or kill a traffic segment that looked weak because tracking did not credit it properly.
Incomplete data does not just distort reporting. It distorts behavior.
Misleading early results
Early results are dangerous because they feel like truth before they become truth.
A campaign can look great in the first 24 hours because:
- it hit a good audience pocket
- frequency is still low
- the platform found easy clickers
- the best creative is still fresh
- rejections have not arrived
- approval has not settled
- spend is too small to expose weakness
Then by Day 3 or Day 5, the picture changes. CPA rises. CTR softens. Approval drops. The tracker gets corrected. The buyer realizes the early win was not stable.
That is why strong teams separate early signal from real validation. Early signal tells you whether something deserves more testing. It does not tell you whether something deserves full scale.
How to detect and stop budget burn
Stopping budget burn is not about becoming scared to spend. It is about making spend earn the next step.
Full funnel analysis
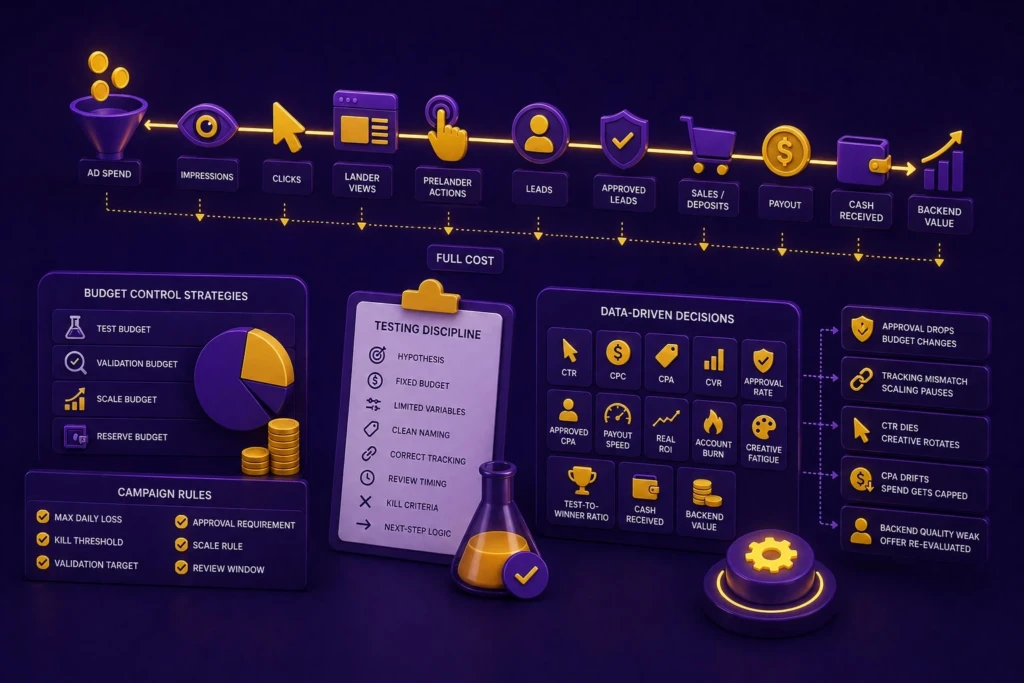
Start by mapping the funnel from spend to cash:
- ad spend
- impressions
- clicks
- lander views
- prelander actions
- leads
- approved leads
- sales / deposits
- payout
- cash received
- backend value
- full cost
Every step should have a conversion rate and a cost. If one step breaks, do not hide it inside blended ROI.
A good buyer asks:
- where is the biggest drop-off?
- which campaign produces approved value, not just leads?
- which creative drives quality, not just clicks?
- which audience survives validation?
- which offer pays reliably?
- where does cashflow get stuck?
That is how you find the leak before it becomes a monthly loss.
Budget control strategies
Budget control is not just “spend less.” It is spending in stages.
A practical structure:
- Test budget: small, controlled, designed to find signal
- Validation budget: larger, used to confirm CPA, approval, and quality
- Scale budget: only for stable setups with clean data
- Reserve budget: kept for recovery, replacements, and unexpected opportunity
Do not let weak tests eat scale money. Do not let old winners starve new discovery. And do not scale just because the buyer wants action.
Every campaign should have:
- max daily loss
- kill threshold
- validation target
- approval requirement
- scale rule
- review window
If those rules are missing, the budget is being managed emotionally.
Testing discipline
Testing discipline is what separates buying from gambling.
A disciplined test has:
- one core hypothesis
- fixed starting budget
- limited variables
- clean naming
- correct tracking
- review timing
- kill criteria
- next-step logic
For example:
Hypothesis: pain-angle static creative can produce approved leads under $22 CPA in GEO X.
Budget: $500.
Kill rule: stop if no qualified lead after $180 or CTR below threshold after sufficient impressions.
Validation rule: continue only if early leads show acceptable quality.
That is a test. “Launch five random ads and see what happens” is not.
Data-driven decisions
Finally, buyers need to stop defending campaigns with feelings.
Useful decision metrics include:
- CTR
- CPC
- CPA
- CVR
- approval rate
- approved CPA
- payout speed
- real ROI
- account burn
- creative fatigue
- test-to-winner ratio
- cash received
- backend value
But the point is not to collect more numbers. The point is to let numbers change behavior.
If approval drops, budget changes.
If tracking mismatch widens, scaling pauses.
If CTR dies, creative rotates.
If CPA drifts beyond threshold, spend gets capped.
If backend quality is weak, the offer is re-evaluated.
Data without decisions is decoration.
FAQ
Why do media buyers lose money even with good metrics?
Because good ad metrics do not always equal real profit. CTR, CPC, CPA, and tracker ROI can look fine while approval, payout timing, backend value, and hidden costs destroy the actual economics.
Where does affiliate marketing budget loss usually happen?
Budget usually leaks across the funnel: weak clicks, poor click-to-lead conversion, low approval, bad backend quality, incomplete tracking, early scaling, and hidden operating costs.
Why do campaigns lose money after looking profitable at first?
Early results are often based on small samples, cheap initial auction pockets, fresh creatives, and incomplete approval data. Once spend increases and validation catches up, the real economics can look much worse.
What are the most common media buying mistakes?
The biggest mistakes are scaling too early, testing too many variables at once, ignoring audience quality, trusting raw tracker ROI, and making budget decisions without full-funnel data.
How can I stop burning budget in Facebook Ads?
Separate test, validation, and scale budgets. Use clear kill rules, track approved revenue, monitor CPA drift, connect ad account data with tracker and network data, and avoid scaling before the campaign has real proof.
What should media buyers track before scaling?
Track spend, CTR, CPC, CPA, CVR, approval rate, approved CPA, payout speed, real ROI, creative fatigue, account stability, and backend quality. Scaling without these numbers means scaling risk.